
使用的平台与技术:Hadoop-2.6.5、Jdk-1.8、Sqoop-1.4.7、Hive-1.2.1、MySql-5.6.24、
Idea2020、Maven-3.6.3
Pycharm2024、Django-3.0.3、Python-3.7.16、PyMysql-1.0.2
项目仓库:https://gitee.com/rongwu651/xg_hive
博客梳理
- 技术选型:使用 Hadoop、Jdk、Sqoop、Hive、MySql、Idea、Maven、Pycharm、Django、Python、PyMysql 等技术搭建项目。
- 数据处理流程
- 创建 Hive 数据表:启动集群和 Hive 客户端后,创建存储疫情数据的表结构。
- 数据上传至集群:通过
hdfs dfs -put命令将本地数据上传到 HDFS。 - 构建 Maven 项目:在 Idea 中创建 Maven 项目,添加 Hadoop 依赖,编写 Mapper、Reducer 和 Main 文件进行数据处理和计算。
- 生成 Jar 包并执行任务:打包 Maven 项目生成 Jar 包,在集群上执行任务,处理后的数据可查看并导入 Hive 表。
- 数据导入 MySql 表:利用 Sqoop 将数据导入 MySql 表(通过Django模型创建的表)。
- Django 项目搭建与配置:创建 Django 项目和应用,定义数据模型,生成并应用数据库迁移文件。
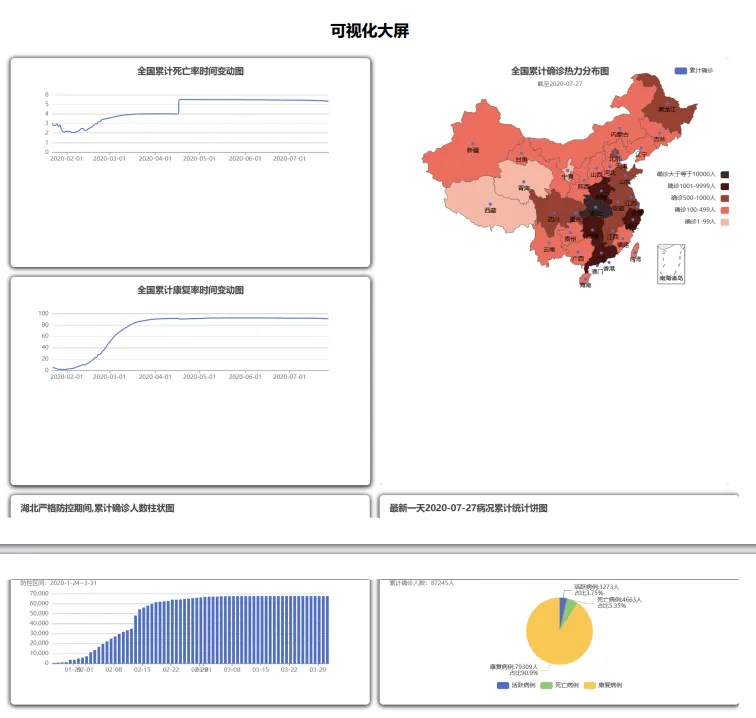
- 前后端数据交互与可视化:编写 view.py 和 urls.py 进行请求响应和映射,通过 html 文件和 jinja2 语法实现前后端数据交互,使用 echarts 进行数据可视化展示多种疫情数据图表。
创建Hive数据表
1. 启动集群和Hive客户端
[root@hadoop100] start-dfs.sh[root@hadoop100] start-yarn.sh[root@hadoop100] hive2. 创建表结构,行格式,分割字段以Tab为结尾
hive > create table xg(date_day string,siwanglv double,kangfulv double,huoyuebingli int,quezhen int,siwang int,huifu int,shenfeng string)row format delimited fields terminated by '\t';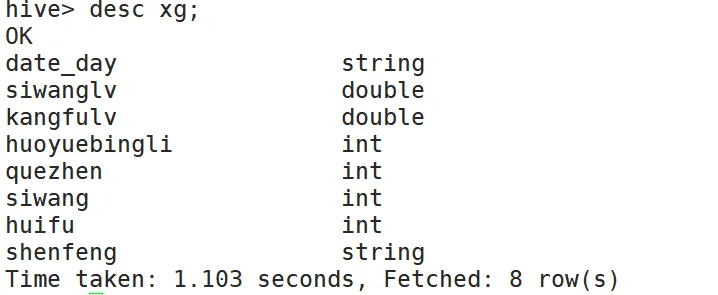
数据上传至集群
[root@hadoop100] hdfs dfs -put /local_path /hdfs_path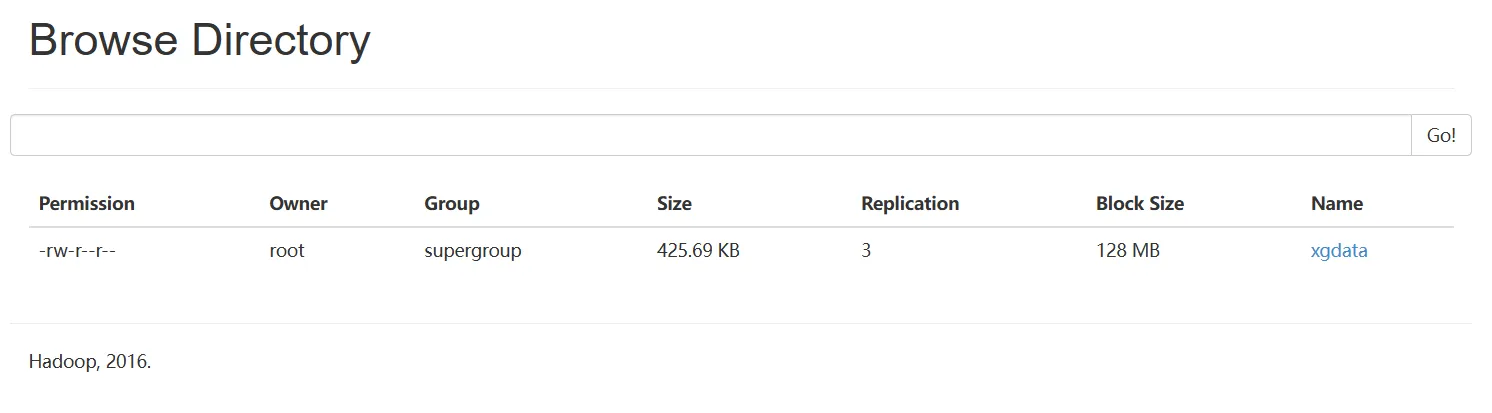
构建Maven项目
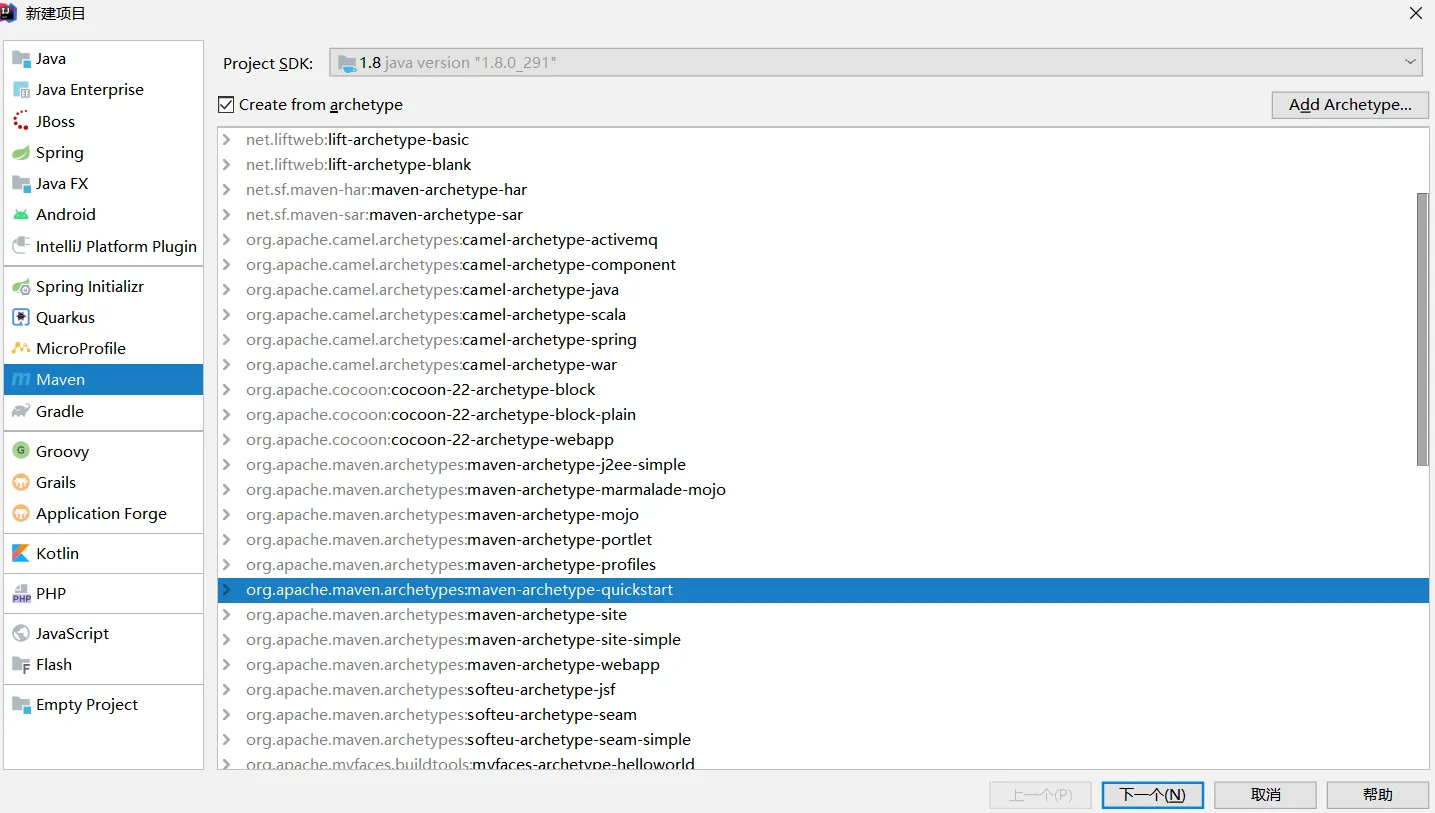
1. 打开Idea-创建项目-Maven项目-选择maven-archetype-quickstart
2. pom.xml文件中添加Hadoop对应版本的依赖并刷新加载
<dependency> <groupId>org.apache.hadoop</groupId> <artifactId>hadoop-common</artifactId> <version>2.6.5</version></dependency><dependency> <groupId>org.apache.hadoop</groupId> <artifactId>hadoop-hdfs</artifactId> <version>2.6.5</version></dependency><dependency> <groupId>org.apache.hadoop</groupId> <artifactId>hadoop-client</artifactId> <version>2.2.0</version></dependency>3. 创建Mapper文件
public class XinguanMapper extends Mapper<LongWritable, Text,Text, NumberInfo>{ //读取写出类型 protected void map(LongWritable key,Text value,Context context) throws IOException, InterruptedException { //按行读取数据,并进行分割存储 String line = value.toString(); Iterable split = Arrays.asList(line.split(",")); ArrayList datas = new ArrayList<>(10);
//存储 for (String s : split){ datas.add(s); } if(datas.size()>9){ //防止字符越界 //过滤,选取所需要的数据 if ("China".equals(datas.get(1))||"Taiwan*".equals(datas.get(1))){ String Province = "China".equals(datas.get(1))?datas.get(0) : "Taiwan";
String date = datas.get(4);//日期 Long Confirmed =Long.parseLong(datas.get(5)) ; //已确诊,累计 Long Deaths = Long.parseLong(datas.get(6)); //死亡,累计 Long Health = Long.parseLong(datas.get(7)); //恢复,累计 //写入 context.write(new Text(date),new NumberInfo(Confirmed,Deaths,Health,Province)); } }
}}3.1 创建对象,便于存储Mapper阶段筛选后的多值,至上下文
实现Writable接口,使该类的对象能够在Hadoop MapReduce作业中作为键或值使用
Writable是Hadoop中用于序列化和反序列化数据的标准接口。
public class NumberInfo implements Writable { private Long Confirmed; //已确诊,累计 private Long Deaths; //死亡,累计 private Long Health; //恢复,累计 private String Province; //省份
public NumberInfo() {}
public NumberInfo(Long confirmed, Long deaths, Long health, String province) {//有参构造 Confirmed = confirmed; Deaths = deaths; Health = health; Province = province; }
@Override public void write(DataOutput dataOutput) throws IOException { //数据写出 dataOutput.writeLong(Confirmed); dataOutput.writeLong(Deaths); dataOutput.writeLong(Health); dataOutput.writeUTF(Province); }
@Override public void readFields(DataInput dataInput) throws IOException {//数据读取 Confirmed = dataInput.readLong(); Deaths = dataInput.readLong(); Health = dataInput.readLong(); Province = dataInput.readUTF(); }
@Override public String toString() { return Confirmed + "\t" + Deaths + "\t" + Health + "\t" + Province; }}4. 设置Reduce文件
public class XinguanReduce extends Reducer<Text, NumberInfo,Text, ResultXinguan> { protected void reduce(Text key,Iterable values,Context context) throws IOException, InterruptedException { if (values!=null){ for (NumberInfo value :values){ ResultXinguan res = new ResultXinguan(value); context.write(key,res); } } }}4.1最终对象
public class ResultXinguan implements Writable { private NumberInfo numberInfo; private double Mortality; //死亡率(死亡/确诊) private double RecoveryRate;//康复率(康复/确诊) private Long ActiveCases; //活跃病例(确诊-死亡-康复) private Long Confirmed; //已确诊,累计 private Long Deaths; //死亡,累计 private Long Health; //恢复,累计 private String Province; //省份
public ResultXinguan() { }
public ResultXinguan(NumberInfo numberInfo) { //数据处理 this.numberInfo = numberInfo; Confirmed = this.numberInfo.getConfirmed(); Deaths = this.numberInfo.getDeaths(); Health = this.numberInfo.getHealth(); Province = this.numberInfo.getProvince(); ActiveCases = Confirmed-Deaths-Health;
if (Confirmed != 0) { Mortality = (double)Deaths / Confirmed; RecoveryRate = (double)Health / Confirmed; } else { Mortality = 0.0; RecoveryRate = 0.0; } }
@Override public void write(DataOutput dataOutput) throws IOException { dataOutput.writeDouble(Mortality); dataOutput.writeDouble(RecoveryRate); dataOutput.writeLong(ActiveCases); dataOutput.writeLong(Confirmed); dataOutput.writeLong(Deaths); dataOutput.writeLong(Health); dataOutput.writeUTF(Province); }
@Override public void readFields(DataInput dataInput) throws IOException { Mortality = dataInput.readDouble(); RecoveryRate = dataInput.readDouble(); ActiveCases = dataInput.readLong(); Confirmed = dataInput.readLong(); Deaths = dataInput.readLong(); Health = dataInput.readLong(); Province = dataInput.readUTF(); }
@Override public String toString() { return Mortality + "\t" + RecoveryRate + "\t" + ActiveCases + "\t" + Confirmed + "\t" + Deaths + "\t" + Health + "\t" + Province; }}5. 创建Main运行文件
public class XinguanMain extends Configured implements Tool { @Override public int run(String[] strings) throws Exception { //判断输入是否正确 if (strings.length != 2){ System.out.println("Usage: XinguanMain input output"); return -1; } //获取用户读取数据、保存数据的路径 String inputPath = strings[0]; String outputPath = strings[1];
//创建实例,设置任务名称和类 Job job = Job.getInstance(super.getConf(),"mapreduce_calculation"); job.setJarByClass(XinguanMain.class);
//设置输入输出类型和路径 job.setInputFormatClass(TextInputFormat.class); TextInputFormat.addInputPath(job,new Path("hdfs://hadoop100:9000"+inputPath)); job.setOutputFormatClass(TextOutputFormat.class); TextOutputFormat.setOutputPath(job,new Path("hdfs://hadoop100:9000"+outputPath)); // 采用默认方式(分区,排序,规约,分组)
//设置Map阶段的类、输入输出 job.setMapperClass(XinguanMapper.class); job.setMapOutputKeyClass(Text.class); job.setMapOutputValueClass(NumberInfo.class);
//设置Reduce阶段的类、输入输出 job.setReducerClass(XinguanReduce.class); job.setOutputKeyClass(Text.class); job.setOutputValueClass(ResultXinguan.class);
boolean b = job.waitForCompletion(true); return b?0:1; }
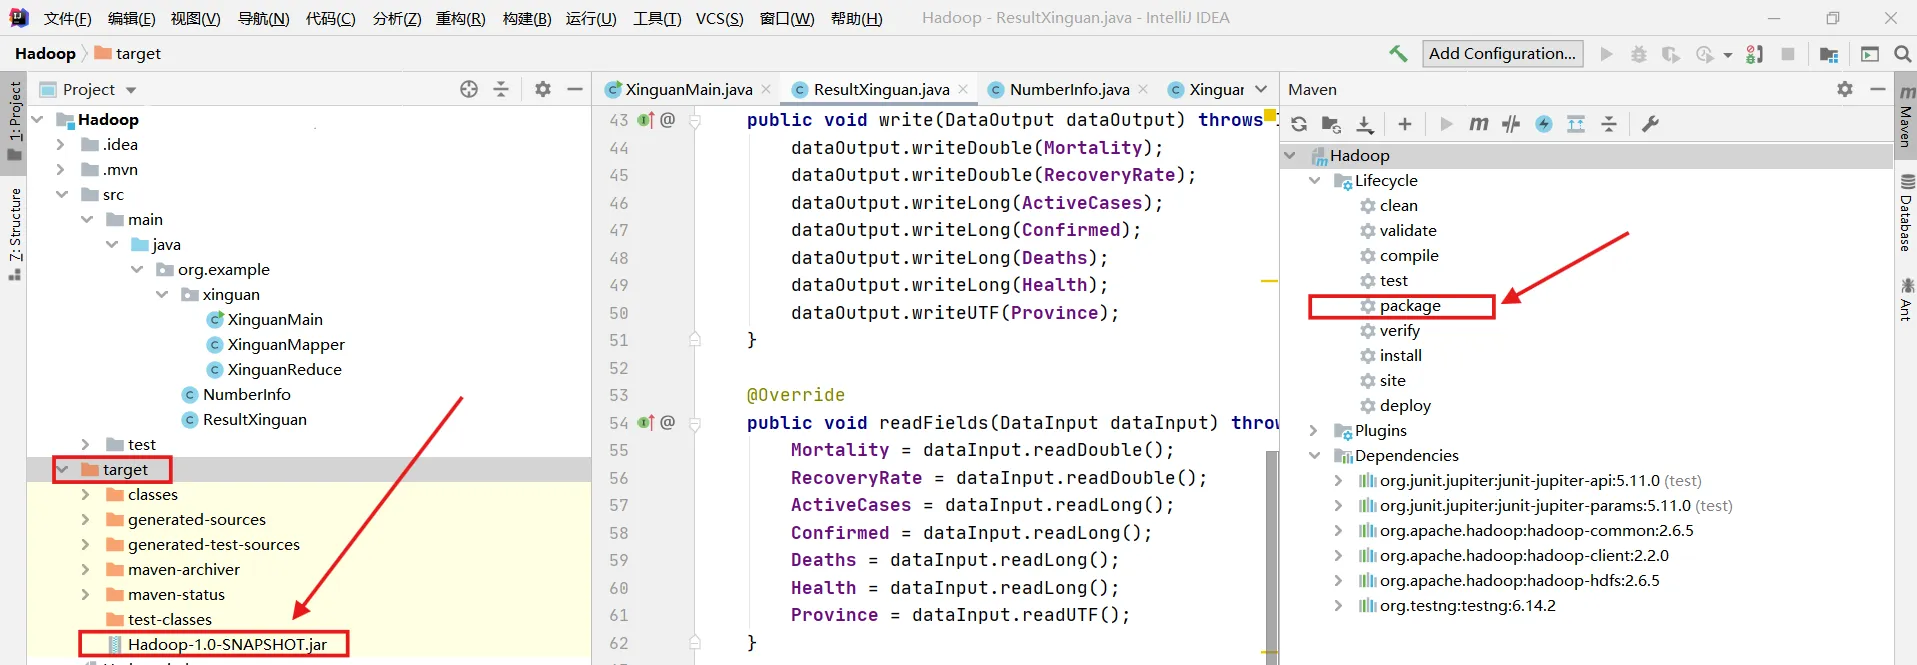
public static void main(String[] args) throws Exception { Configuration configured = new Configuration(); ToolRunner.run(configured,new XinguanMain(),args); }}生成Jar包并执行任务
1. 打包之后生成的文件在该项目的target文件夹下
2. 执行任务
- Main文件中,读取的地址设置的是HDFS路径
- 执行任务需要输入完整包名
- 输出路径必须不存在
[root@hadoop100 /] mv Hadoop-1.0-SNAPSHOT.jar xg.jar [root@hadoop100 /] hadoop jar xg.jar org.example.xinguan.XinguanMain /hdfs_inputPath /hdfs_outputPath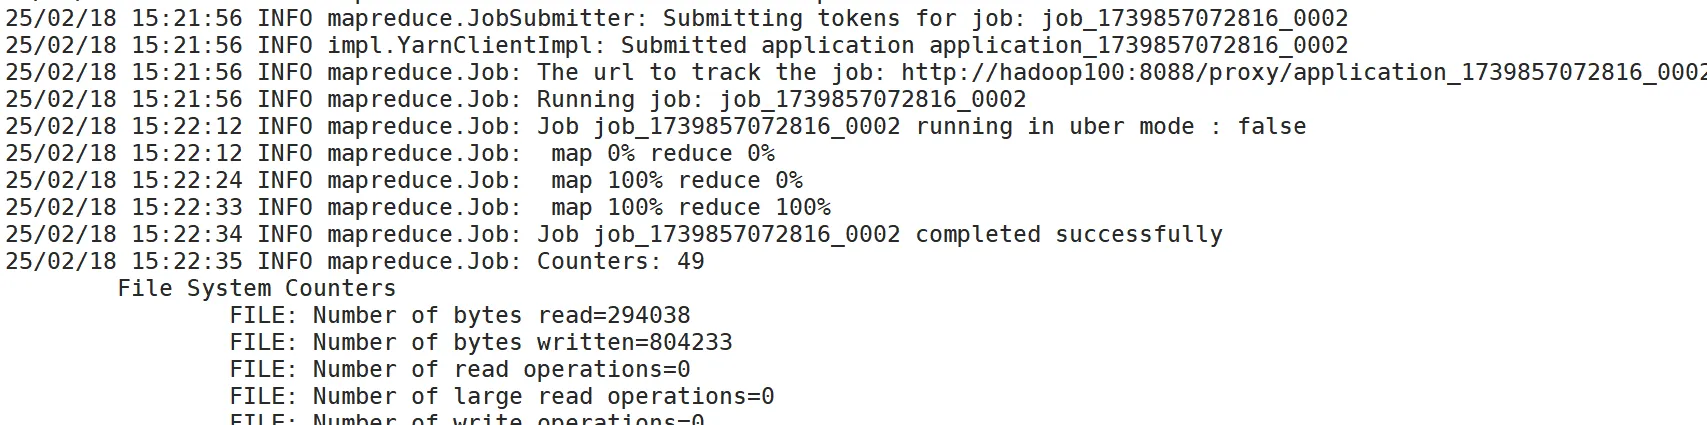
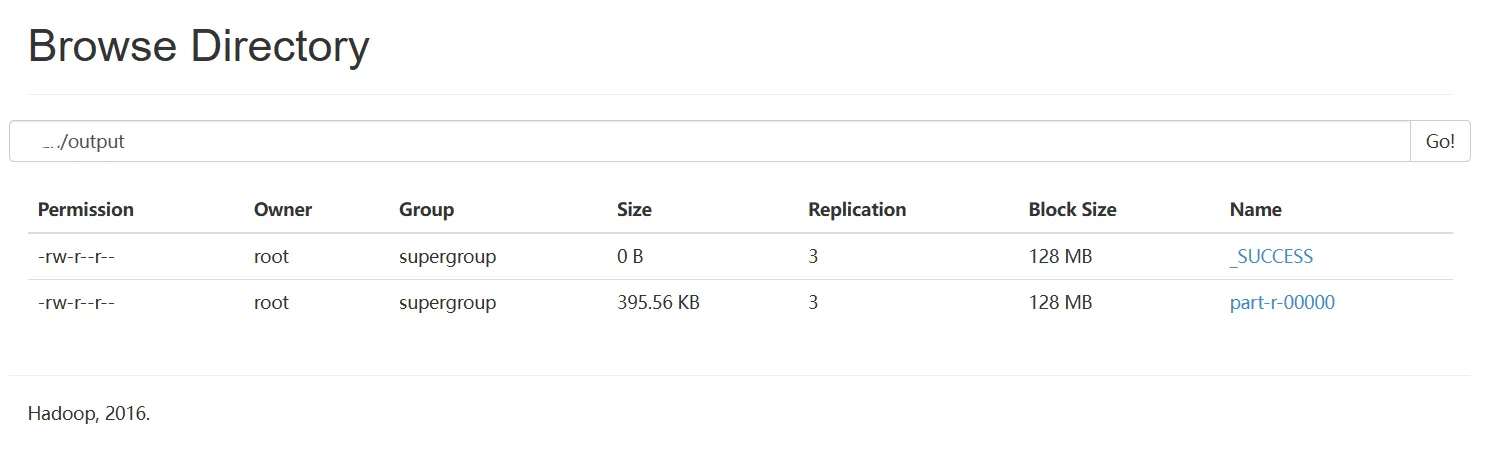 3. 查看数据结果
[root@hadoop100 /]hdfs dfs -get /hdfs_path/part-r-00000 txt[root@hadoop100 /]head txt2020-01-22 0.0 0.0 0 0 0 0 Gansu2020-01-22 0.0 0.0 26 26 0 0 Guangdong2020-01-22 0.0 0.0 2 2 0 0 Guangxi2020-01-22 0.0 0.0 1 1 0 0 Guizhou2020-01-22 0.0 0.0 4 4 0 0 Hainan2020-01-22 0.0 0.0 1 1 0 0 Hebei2020-01-22 0.0 0.0 0 0 0 0 Heilongjiang2020-01-22 0.0 0.0 5 5 0 0 Henan2020-01-22 0.0 0.0 0 0 0 0 Hong Kong2020-01-22 0.038288288288288286 0.06306306306306306 399 444 17 28 Hubei[root@hadoop100 /]wc -l txt6392 txt数据导入Hive表中
hive >load data inpath '/hdfs_path/part-r-00000' into table xg;创建、配置Django项目和应用
Django搭建与配置 不会搭建配置(mysql、app)可参考该pdf文件
![]()
创建数据模型
python manage.py makemigrations 生成数据库迁移文件
python manage.py migrate 将生成的迁移文件应用到数据库,实际修改数据库结构。
1. 创建数据模型
class xgdata(models.Model): date_day = models.CharField(max_length=20) siwanglv = models.FloatField() kangfulv = models.FloatField() huoyuebingli = models.IntegerField() quezhen = models.IntegerField() siwang = models.IntegerField() huifu = models.IntegerField() pro = models.CharField(max_length=100) pro_cn =models.CharField(max_length=100)2. 生成数据库迁移文件,修改数据库结构
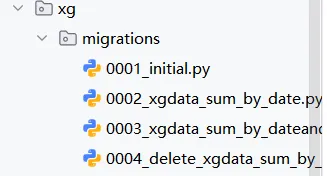
manage.py@Hadoop > makemigrations appnamemanage.py@Hadoop > migrate appname生成的迁移文件会保存在该app的migrations文件夹下
数据导入MySql表中
[root@hadoop100] sqoop export \--connect jdbc:mysql://hadoop100/xg_xgdata \--username root \--password 123456 \--table xg \--target-dir /hdfs-path \--fields-terminated-by '\t'编写请求响应view.py和urls.py映射
视图层
一个视图函数,简称视图,是一个简单的 Python 函数,它接受 Web 请求并且返回 Web 响应。响应可以是一个 HTML 页面、一个 404 错误页面、重定向页面、XML 文档、或者一张图片…
# view.pydef get_xgdata(request): # 原始数据集,访问show页面返回数据集全部内容 xgdata_ODS = xgdata.objects.all() context = {'xgdata':xgdata_ODS} return render(resquest,'show.html',context)# urls.pyurlpatterns = [ path('',xg.views.index), path('admin/', admin.site.urls), path('show.html/',xg.views.get_xgdata) #映射]前后端数据交互
编写html文件,我们可以使用jinja2语法,通过特征字段获取视图层编写的函数所传递的数据内容
<body> <div> {% for i in xgdata %} {{ i.date_day }} {{ i.kangfulv }} <br> {% endfor %} </div></body>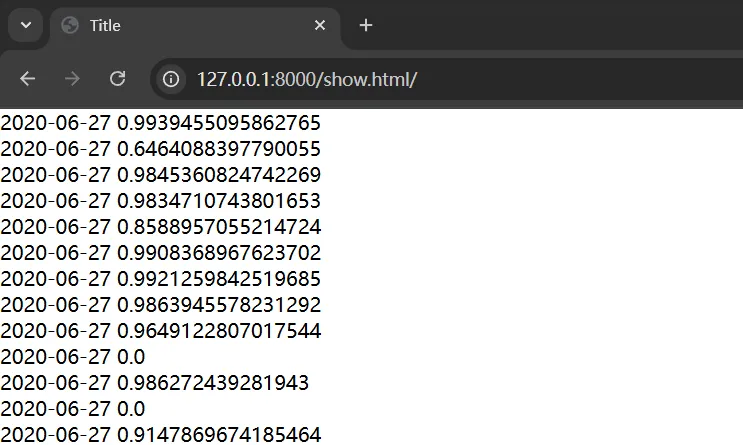
echarts数据可视化
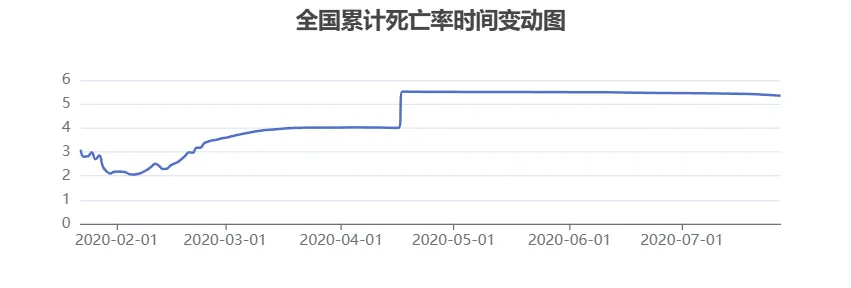
以折现图为例
<div id="line1" style="width:400px;height:200px"></div><script type="module">// 初始化 echarts 对象 var line1 = echarts.init(document.getElementById('line1')); var series_data = []; var xAxis_data = []; {% for i in xgdata_sum %} xAxis_data.push(new Date("{{ i.date_day }}").getTime()); series_data.push({{i.siwanglv}}*100) {% endfor %}// 构造 series.data 所需的数据格式 const data = xAxis_data.map((date, index) => [date, series_data[index]]);// ECharts 配置 const option = { title: { text: '全国累计死亡率时间变动图', left: 'center' }, tooltip: { //悬浮显示 trigger: 'axis', axisPointer: { type: 'cross' //十字架 }, formatter: function (params) { var date = echarts.format.formatTime('yyyy-MM-dd', params[0].value[0]); return `${date}<br/>死亡率: ${(params[0].value[1]).toFixed(2)}%`; } }, xAxis: { type: 'time', axisLabel: { formatter: function (value) { return echarts.format.formatTime('yyyy-MM-dd', value); } } }, yAxis: { type: 'value' }, series: [{ data: data, type: 'line', smooth:true, symbol:'none', }], markLine: { // 标记线,可用于显示平均值或其他参考线 data: [{ type: 'average', name: '平均值' }] }};// 使用 ECharts 实例设置配置line1.setOption(option);</script>